

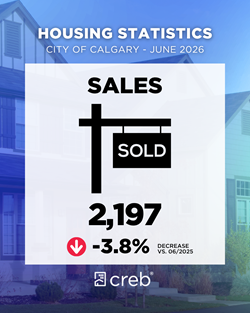
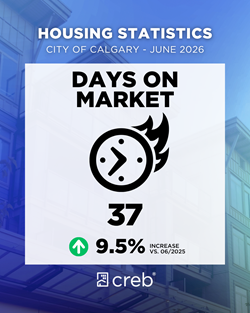
June sales in Calgary improved over May, reaching 2,197 units. Despite the monthly gains, sales were nearly four per cent lower than last year and just below the long-term average for June, largely due to pullbacks in apartment-style units. While sales are down across most price ranges so far this year, there have been gains in both the highest price ranges and the most affordable ranges across most property types.
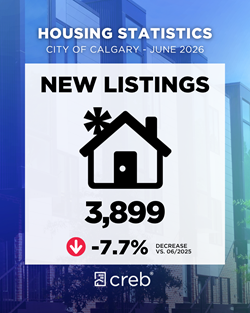
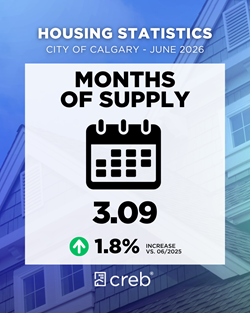
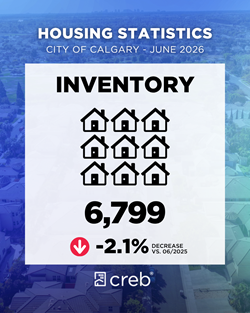
“The easing of demand for resale homes does not come as a surprise given the recent decline in migration, which is impacting both rental and ownership demand for higher-density homes. The bigger change in our market relates to inventory, which has been on the rise in the rental, resale and new-home markets following several consecutive years of record-high housing starts,” said Ann-Marie Lurie, Chief Economist at the Calgary Real Estate Board (CREB®). “Inventory growth has mostly occurred in high-density homes, resulting in buyer’s market conditions and steep price adjustments for condominium apartments. While it will take time to absorb the high-density supply, detached supply growth has been limited and some districts are reporting record-high prices.”New listings are starting to pull back compared with 2025 and the sales-to-new-listings ratio rose to 56 per cent. This has slowed the pace of inventory growth in the market and kept the months of supply at just over three months. This is considered a balanced range in the city, but conditions vary across property types, as the apartment condominium sector is experiencing buyer’s market conditions, with the months of supply at nearly five months and a sales-to-new-listings ratio of 45 per cent.
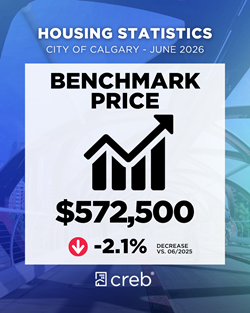
The range of conditions is also impacting prices. In June, the unadjusted benchmark price was $572,500, up over the previous month and two per cent below levels reported last June. However, apartment-style properties have reported an annual decline nearing nine per cent, leaving condominium prices in June at $299,000. Meanwhile, the benchmark price for a detached home rose over the previous month, reaching $750,500, one per cent below last year’s level, with most of the adjustments driven by specific pockets of the market.
Find sharable monthly stats from CREB® on Facebook, Instagram, Threads, TikTok and YouTube.
Click here to view the full City of Calgary monthly stats package.
Click here to view the full Calgary region monthly stats package.


{ 0 comments…}