

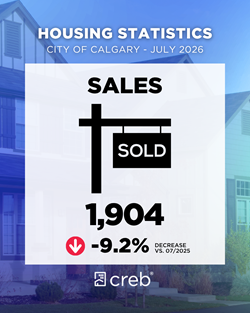
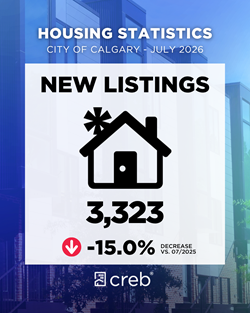
Sales were nine per cent lower than last year’s levels, while new listings were 15 per cent lower. The adjustment in both sales and new listings caused little change in the sales-to-new-listings ratio, which sat at 57 per cent.
In July, the unadjusted total residential benchmark price was $569,200, down slightly over June and two per cent lower than levels reported last year. The persistent oversupply of apartment condos is contributing to a steeper price decline of over eight per cent. Meanwhile, at the other end of the spectrum, detached prices have eased by under two per cent compared to last year, mostly driven by adjustments in the North East and North Districts.
“Several consecutive years of high construction levels and the sudden drop in mostly international migration have contributed to the shift in housing market conditions mostly for higher-density homes, a transition that started in the second half of last year,” said Ann-Marie Lurie, Chief Economist at the Calgary Real Estate Board (CREB®). “While new home construction is slowing, there are over 17,000 apartment-style units under construction. This continues to weigh on rental and higher-density properties, driving price adjustments.”
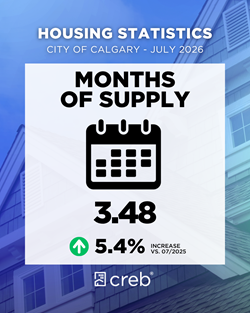
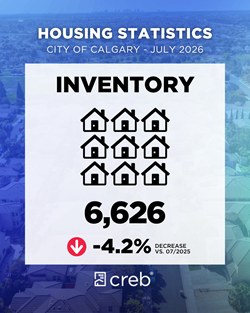
While demand has slowed this year, levels remain stronger than those reported during the challenging market conditions experienced from 2015 to 2019. What has shifted significantly is the additional supply choice across the housing spectrum. Total resale inventory levels remained relatively stable compared to both June and July 2025. However, the slower July sales pushed the months of supply up to three and a half months. While the months of supply is rising across all property types, conditions remain mostly balanced in the detached and semi-detached sectors. In the higher-density sectors, the market continues to favour the buyer for apartment-style homes with nearly five months of supply, while row is experiencing some signs of oversupply.
To read the full stats release on July’s housing market for Calgary and surrounding areas, click here.
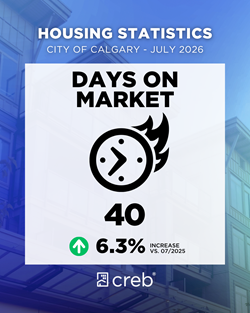
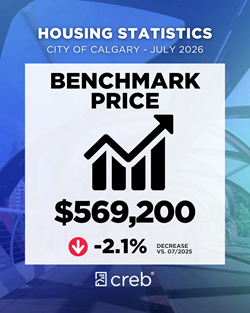
Find sharable monthly stats from CREB® on Facebook, Instagram and LinkedIn.
Click here to view the full City of Calgary monthly stats package.
Click here to view the full Calgary region monthly stats package.



{ 0 comments…}